How to Count Macros from Restaurant Meals Accurately
Accurately tracking macronutrients at restaurants requires deconstructing composite dishes, accounting for unlisted cooking fats, and validating automated photo estimates against preparation methods. Commercial kitchens optimize for flavor and texture rather than dietary precision, creating nutritional variance that standard database entries miss. By applying structured estimation rules and refining entries with manual adjustments, you can track intake consistently without avoiding social dining.
The Core Challenge: Why Restaurant Nutrition Diverges from Home Cooking
The primary challenge in tracking restaurant meals is ingredient density rather than portion volume. Commercial culinary techniques rely on butter, neutral oils, heavy cream, and sugar-based glazes to enhance mouthfeel and caramelization. These additions rarely appear on menus, yet they substantially alter energy and macronutrient profiles.
For example, a six-ounce skinless chicken breast cooked at home contains roughly 180 calories, 38 grams of protein, and 3 grams of fat. In a restaurant kitchen, that same portion is often brined with sugar, seared in clarified butter, and finished with a pan sauce. These steps can add 15 to 20 grams of fat and several grams of carbohydrates, raising total calories by more than 50 percent without visibly altering the portion size.
Omitting these hidden ingredients leads to routine underreporting, which impedes body composition progress. To track restaurant meals reliably, evaluate each dish based on commercial preparation methods rather than raw ingredient weight.
- Takeaway: Assume commercial preparations include added fats and finishing agents unless explicitly prepared dry or steamed.
The Component Deconstruction Method
Accurate estimation begins by mentally separating a composite meal into four categories: lean protein, dense starches, fibrous vegetables, and cooking mediums. Searching for a generic restaurant entree name in a database almost always introduces substantial error.
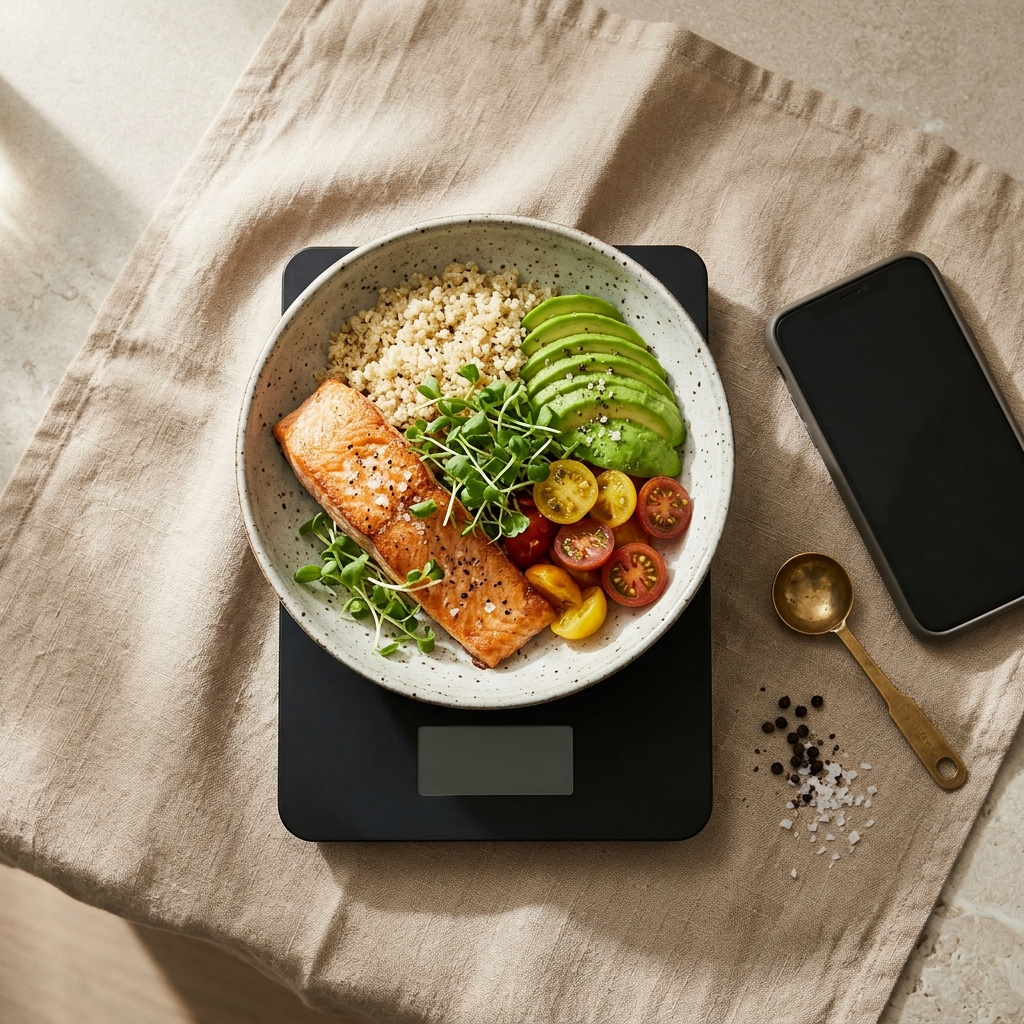
Start by isolating the primary protein. Use standard visual references: a deck of cards represents roughly 3 to 4 ounces of lean meat, while the palm of an average hand equals 4 to 6 ounces. For fish, factor in surface area and thickness; a fillet spanning an entire palm typically yields 5 to 7 ounces of cooked weight.
Next, assess dense carbohydrates such as rice, potatoes, or pasta. A clenched fist correlates to approximately one cup of cooked starch, providing roughly 45 to 50 grams of carbohydrates. Plain fibrous vegetables like broccoli or asparagus contribute negligible calories; their nutritional impact comes almost entirely from added butter or oil.
- Takeaway: Break down composite entrees into distinct raw components rather than logging generic single-item database entries.
Accounting for Added Cooking Fats and Dressings
Cooking fats represent the largest source of tracking error in restaurant dining. Kitchens rely on high-smoke-point oils, clarified butter, and animal fats, using them generously across multiple cooking stages.
To account for these hidden lipids systematically, apply standardized fat buffers based on menu preparation terms:
- Pan-seared, sautéed, or roasted: Add 1 tablespoon of fat (14 grams, ~120 calories) per component.
- Crispy, glazed, or battered: Add 1.5 to 2 tablespoons of fat (21 to 28 grams, ~180 to 250 calories) to account for absorption and starch coatings.
- Grilled or broiled: Add 0.5 tablespoons of fat (7 grams, ~60 calories) for grate oil and finishing butter.
- Steamed or poached: Add no additional fat, provided the item is served without butter sauces.
Always request dressings and emulsified sauces on the side to enable visual measurement. A standard ceramic ramekin holds 2 fluid ounces (4 tablespoons). Consuming half the ramekin allows you to log precisely 2 tablespoons of dressing.
- Takeaway: Standardize fat adjustments based on cooking terminology rather than guessing each component separately.
Enhancing Accuracy with Foodly Photo Analysis and Confidence Scoring
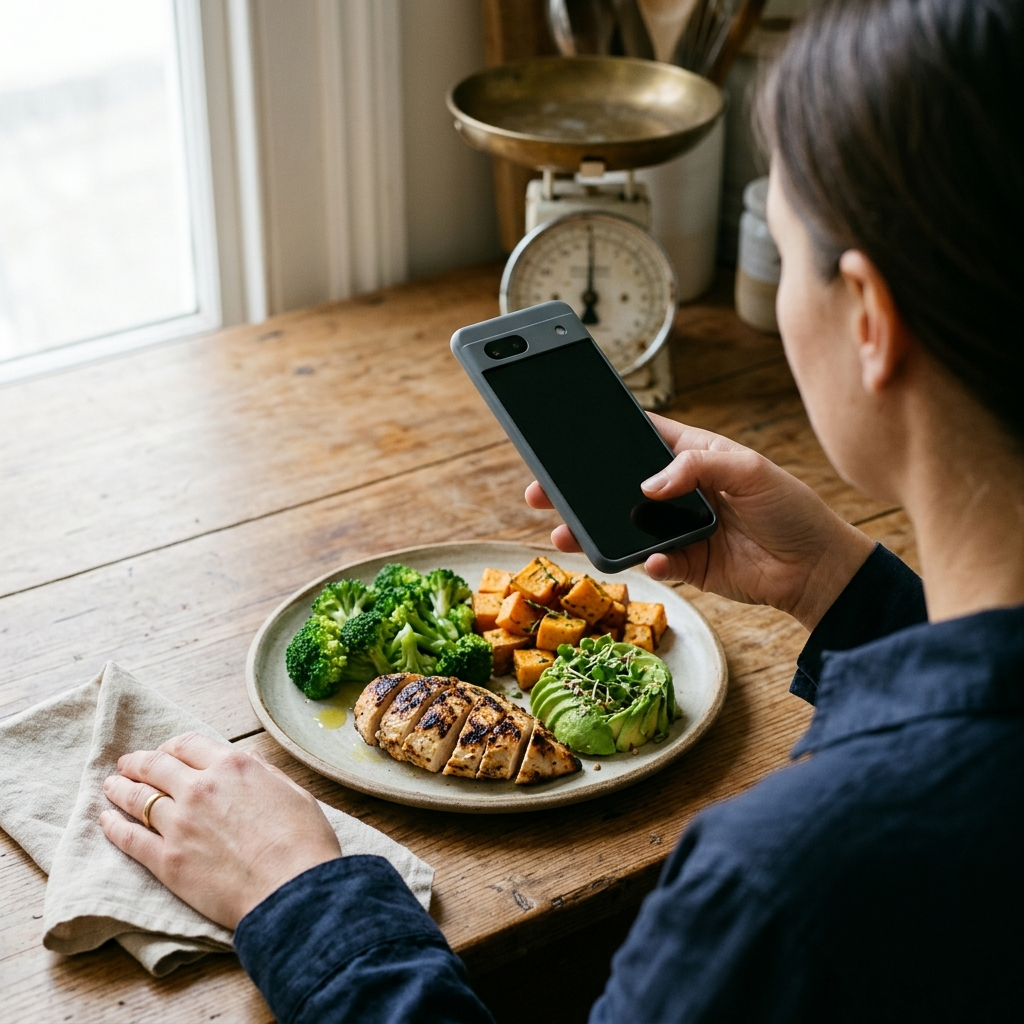
Automated visual tracking tools reduce the manual effort of meal deconstruction. Foodly uses AI food recognition to analyze photos of your meal, identifying ingredients and estimating portion sizes directly from your device.
Because commercial recipes often conceal interior ingredients, Foodly assigns a smart confidence score to each nutritional estimate. Distinct items—such as a grilled chicken breast alongside steamed potatoes—receive high confidence ratings due to clear visual boundaries. Mixed or layered dishes, such as curries or gratins, produce lower confidence scores, signaling that the ingredient ratios warrant manual verification.
When reviewing Foodly's analysis, use the confidence score to decide where manual overrides are necessary. If the app detects a seared salmon fillet but reports moderate confidence on the cooking medium, you can use the manual override feature to add 10 grams of fat for visible pan oil or glaze. This workflow combines fast automated logging with your firsthand observations.
- Takeaway: Use Foodly for instant ingredient and portion recognition, then consult the confidence score to apply targeted manual overrides.
A Step-by-Step Protocol for Dining Out
A systematic routine minimizes estimation errors and supports consistent tracking. Follow this protocol when dining out:
- Review the menu in advance: Choose dishes featuring distinct proteins and starches, which are simpler to estimate than casseroles or mixed stews.
- Clarify preparation requests: Ask for proteins to be prepared without finishing butter, and request all sauces and dressings on the side.
- Capture an overhead photo: Take a clear photo of your plate with Foodly before eating, ensuring adequate lighting for accurate segmentation.
- Review the AI breakdown: Check the detected food items, portion estimates, and macro totals, noting the confidence score for each element.
- Apply manual overrides: Adjust fats or carbohydrates upward if the dish shows visible gloss, frying, or marinades not captured in the scan.
- Confirm the entry: Save the meal to update your real-time macro balance and remaining daily targets.
- Takeaway: Follow a structured process before, during, and after your meal to maintain data consistency.
Evaluating Weekly Macro Trends Over Single-Meal Precision
Exact precision when tracking restaurant meals is impractical due to natural culinary variation. Kitchen staff vary the amount of oil, seasoning, and sauce used across identical orders, making absolute precision an unrealistic standard.
The goal is directional accuracy. A variance of 100 to 150 calories on an occasional restaurant meal will not disrupt long-term progress if your weekly energy balance aligns with your target. Foodly's dashboard analytics and weekly trend tracking place individual meals within the broader context of your nutritional patterns.
If weekly trend data shows stalled progress despite regular logging, adjust your baseline restaurant fat buffer upward by 5 grams per meal. This systematic calibration keeps your tracking aligned with real-world outcomes.
- Takeaway: Prioritize multi-week trend consistency over minor calorie discrepancies in individual meals.
Conclusion
Accurately tracking restaurant macros is an applied skill built on meal deconstruction, consistent fat buffers, and reliable digital tools. By breaking plates into primary macronutrient sources, accounting for preparation lipids, and using Foodly's photo analysis with manual override adjustments, you can maintain dietary accountability in any dining environment.
Frequently Asked Questions
For pan-seared, roasted, or sautéed foods, add 1 tablespoon (14 grams) of fat per component. For crispy, battered, or deep-fried dishes, add 1.5 to 2 tablespoons (21 to 28 grams) of fat to account for oil absorption.
Foodly evaluates the meal via photo recognition and provides a smart confidence score. When dishes contain potentially hidden fats or sauces, the confidence score alerts you to review the breakdown and apply a manual override to adjust fats accurately.
Plates with separated, whole-food components are easiest to track. Examples include grilled or broiled steak, chicken breast, or fish paired with baked potatoes, steamed rice, and plain steamed vegetables with sauces served on the side.
A minor estimation variance in a single meal will not disrupt long-term progress. Monitoring weekly trend analytics rather than obsessing over absolute precision in a single meal keeps your overall energy balance on target.